From the archive. This article is preserved as originally published. References to laws, technology and events reflect its publication period.
Read the image description
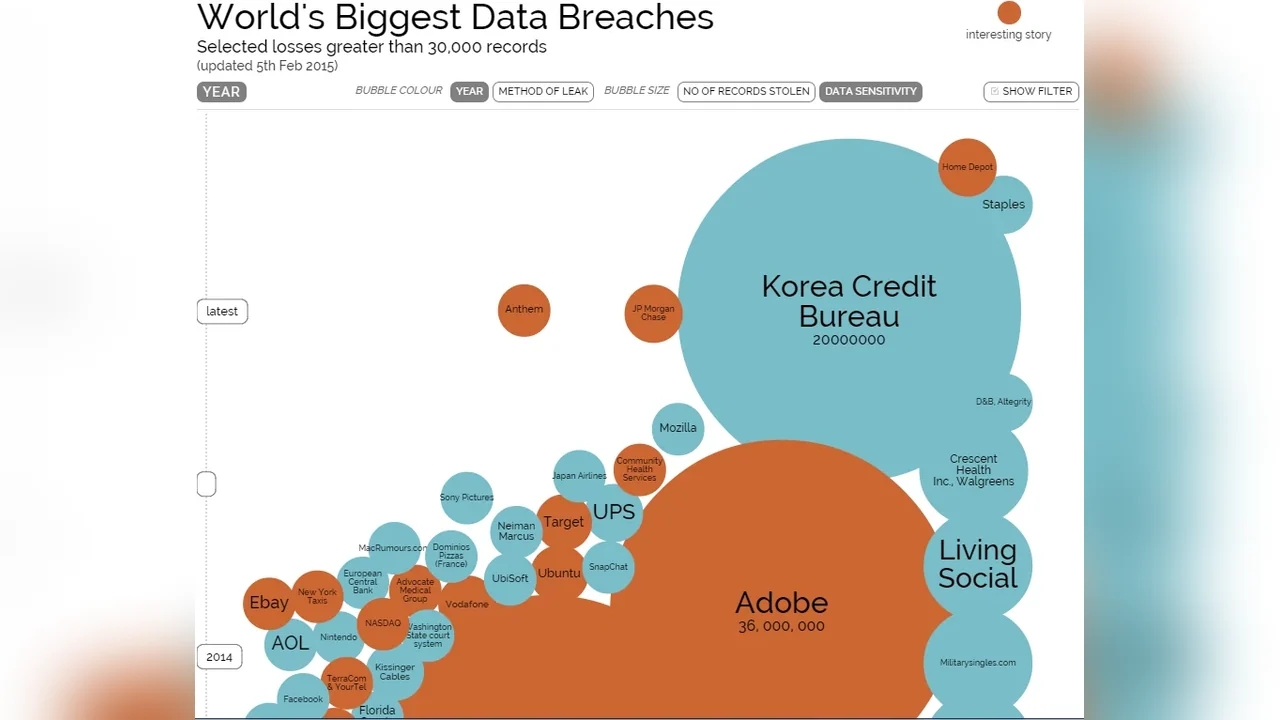
This historical bubble chart compares selected data breaches using circle area to represent affected records. Adobe is shown as a much larger breach than Korea Credit Bureau, while LivingSocial is another prominent example. The chart is a historical snapshot of selected incidents, not a current or complete register of breaches.
Came across a very useful tool for visualising data loss incidents (at least the ones we know about...). The figure above links to the original site. Well worth a read.
Original WordPress publication ↗
Personal commentary. Views are the author’s own.